The Power of Visual Storytelling: Guidelines for Creating Infographics

Infographics are visually engaging representations of information and data that help businesses reach their target audience. Infographics do this by turning complicated subjects into captivating content, getting your message across quickly and clearly. They also illustrate your expert understanding of a subject.
And, in today’s fast-paced technology-driven world, it is no surprise that infographics are on the rise. Ninety percent of the information that comes to the brain is visual and visuals are known to improve learning and retention by 400%.
Infographics, therefore, harness the power of graphics to enhance the visual system’s ability to see trends and patterns.
Infographics can be used in a variety of ways to effectively communicate information that helps drive to a desired outcome. Some examples include:
- Visualize data from one or multiple sources (statistical)
- Compare two or more concepts – products, services, ideas, etc. (comparison)
- Communicate a particular concept or idea more clearly (informational)
- Visualize the historical sequence of a particular activity or event (timeline)
- Provide an overview of the steps in a particular process (process)
- Make linkages to information tied to particular locations or geographies (geographical)
- Organize information from greatest to least or some other relevant hierarchy (hierarchical)
- Share a collection of something relevant to your audience – tips, resources, examples, etc. (list)
When creating an infographic there are a few best practices that marketers and business owners should always keep in mind to make the most of their content:
Curate and simplify your content
In order to sustain the attention of your audience, content should be thoughtful, helpful and easy to digest. Highlight key pieces of information for the chosen topic with minimal use of words. It is important not to overwhelm the reader with too much information at once.
Look externally for inspiration
Before starting an infographic, browse the web for inspiration and also check out infographics that a particular company has had done previously. This search helps ignite creativity and gives some idea of the best direction to start in. Dribble, Behance and Pinterest are good sources of inspiration.
Balance imagery and text
An effective infographic has a good balance of visual information with written information. When content is finalized, a wireframe can be created to map out the hierarchy and flow of your content. Unique imagery in the form of icons, illustrations and photos should represent the content in an effective and aesthetically pleasing manner. Whitespace is very important as it ensures ease of flow and readability. Imagery may be custom designed for the infographic or stock imagery may be purchased online.
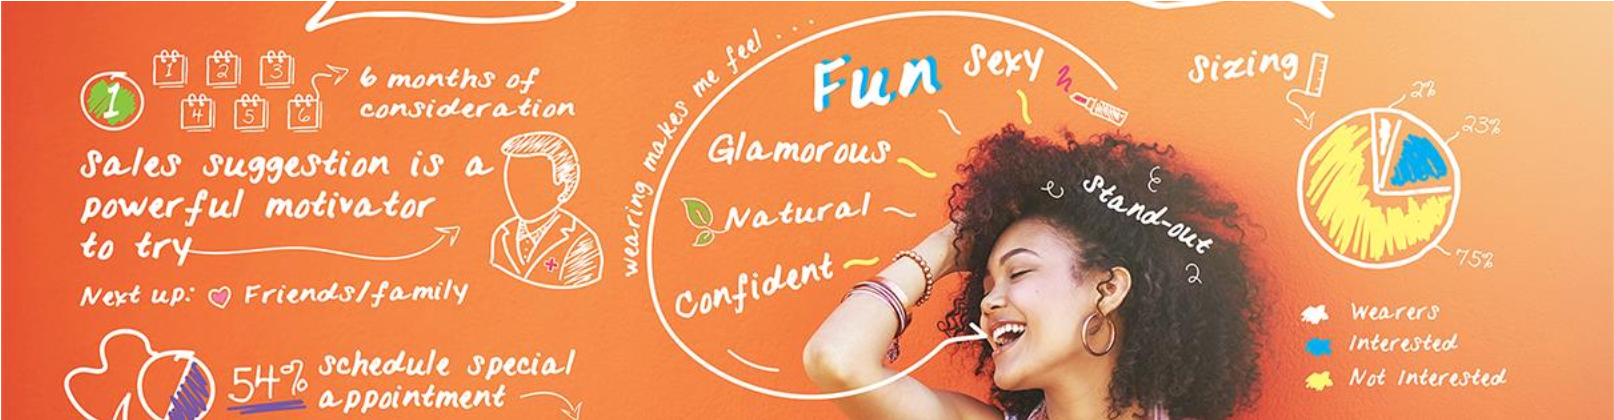
Pro tip: Try something new! The image above (a snippet of a complete infographic) was created using a combination of photographs and hand drawn elements.
Leverage your brand logo and colors
Infographics can be used to build your brand and increase engagement. Include your logo and carry your brand colors throughout the infographic to create a greater brand awareness.
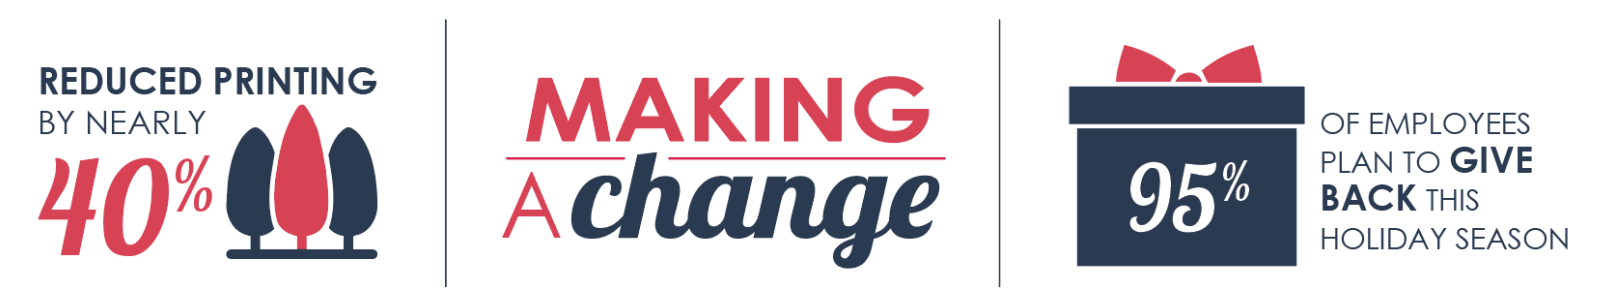
Pro tip: Create an infographic showcasing interesting facts about your firm. The image above was taken from our most recent holiday card.
Include share and social links
The addition of sharing buttons in your infographic can increase awareness about your business, further your reach and up social shares. Include links to your social media pages and add either a link or a clickable logo to drive traffic to your website.
The use and benefits of infographics are vast and should be considered whenever there is a need to communicate information in a succinct and compelling way to get your brand’s key messages across.