All businesses strive to preserve and cultivate their customer base, but what is the most effective way to generate this growth? To help monitor and grow the number of repeat customers, businesses should incorporate customer satisfaction and loyalty improvement into their long-term goals. If customers continue to feel satisfied with their experiences, they will likely become loyal customers. Market research can play a very important role in discovering why customers are satisfied and loyal, or why they are not. Key driver analysis (KDA) is a powerful tool in market research to determine the drivers of satisfaction and loyalty.
KDA is a modeling technique that identifies a subset of attributes, known as key drivers, which have a strong influence on a target metric (e.g., overall satisfaction, loyalty, likelihood to recommend). These key drivers provide insights on the best areas of focus that will lead to improvements in satisfaction, loyalty or other target metrics. As an example, consider a company that has experienced a decrease in overall satisfaction, as identified in a quarterly customer survey. While informative, this metric does not directly lend itself to a business action to improve satisfaction. As a next step, the business could use evaluative metrics collected in the same survey such as perceptions of technical support, value, and brand. In this example, KDA can be run with overall satisfaction as the target attribute (or dependent variable) and the other metrics as predictors/drivers (or independent variables). A driver score is calculated and assigned to each predictor to indicate the level of importance or influence that attribute has on overall satisfaction. The attributes with higher importance scores (meaning they have the most influence on the target attribute) can then be improved with additional resources with the goal of increasing overall satisfaction.
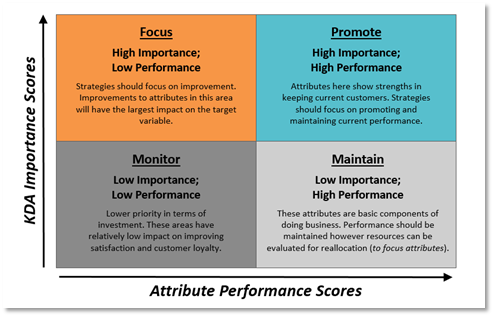
Quadrant maps are an interesting and insightful approach to present KDA results. Quadrant maps plot the KDA importance scores vs. the attribute performance scores. Using these two key pieces of information, each driver will be classified into one of the four quadrants. The quadrant that should be of primary focus for businesses is the upper-left quadrant (High Importance; Low Performance). Improving these attributes/business areas will have the largest impact on the target attribute. The attributes appearing in the “Promote” quadrant (High Importance; High Performance) are strengths of the business and should be promoted and maintained.
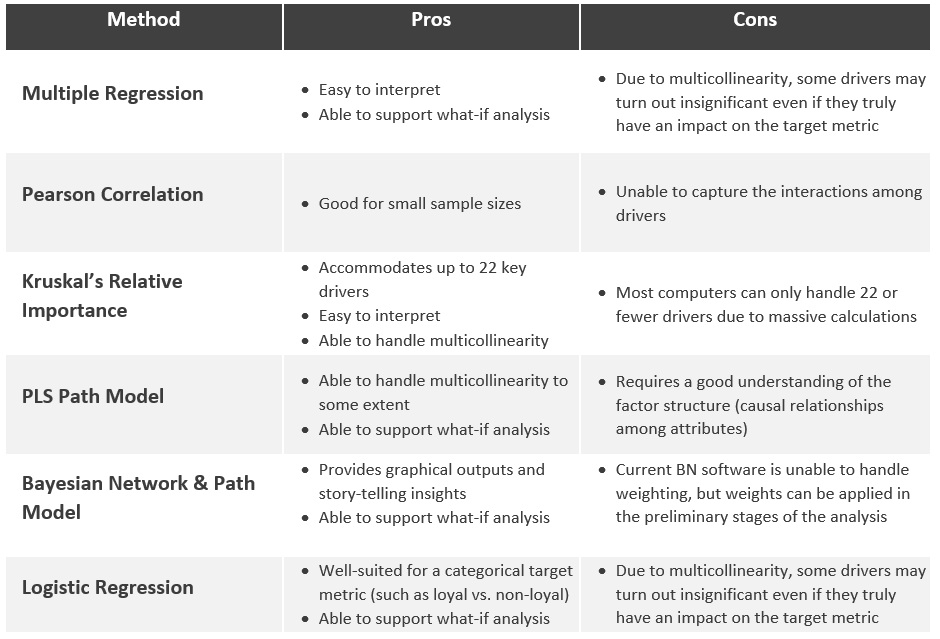
There are a wide array of modeling techniques that can be used to conduct KDA as shown in the table below. Businesses should work alongside their market research vendors to ensure the best approach is used for the particular study so that highly actionable results are achieved.
Key driver analysis is a very effective way to uncover what determines customer satisfaction and loyalty. Aligning the research and business objectives to facilitate a KDA will help ensure this analysis provides valuable insights that lead to specific business recommendations.


