How do consumers see my product in relation to competitors in the marketplace? What are the perceived advantages and disadvantages of my brand among current and potential consumers? These are the often-asked questions when an organization faces competitive pressures. Further, an even more powerful question to ask is “How should I position my product to grow my business?”
Answering the last question involves two aspects:
- Identify distinct areas of advantage
- Quantify the key product drivers
Ideally, your organization will have differentiating advantages that align perfectly with key drivers – in other words, your brand delivers on what is most important to consumers in a way that stands out from the competition. To clearly determine how well your brand performs in the competitive context, a perceptual map can plot these brands and add in importance of the brand attributes to define opportunities. This approach will allow marketers to understand where to position their product so that it not only occupies a unique position in the market, but also a position that represents features that drive product selection.
Standard Perceptual Map
A Perceptual Map (also known as a Positioning Map or a Market Map) is a frequently used technique in branding studies that visually displays the perceived advantages and disadvantages of brands in the market. To create a typical perceptual map, respondents are asked to rate their perceptions of each brand across a set of attributes that are relevant to the purchase decision in the product category, for example:

A perceptual map plots the attributes on a two-dimensional chart, showing how the target consumer perceives and understands the positioning of competing brands in the market.
In the analytic phase, means or the percentage scores of each attribute are calculated. Based on these scores, a statistical method called correspondence analysis plots the brands on a two-dimensional map. When reading a perceptual map:
- Brands located far apart from each other on the map are well differentiated. Brands that are closely located on the map are not as well differentiated.
- The attributes that are closest to a brand are potential opportunities for differentiation.
Representing Importance in Perceptual Map
Typically brand managers are asked to look for open space so that new products can be positioned to fill an unoccupied or unique niche in the market however what if that position is one that is characterized by attributes that are not important to consumers and therefore do not drive the purchase decision? In a standard perceptual map there is no way to tell whether a position on the map is associated with important or unimportant attributes. An enhanced perceptual map, connecting attribute importance, is needed.
There are multiple ways to determine the importance of the attributes shown in the perceptual map, such as Key Driver Analysis (including techniques like Kruskal’s relative importance, multiple regression, or PLS path modeling, etc.) and MaxDiff Analysis (For details on Key Driver Analysis and MaxDiff Analysis, please refer to these two articles: KDA and MaxDiff).
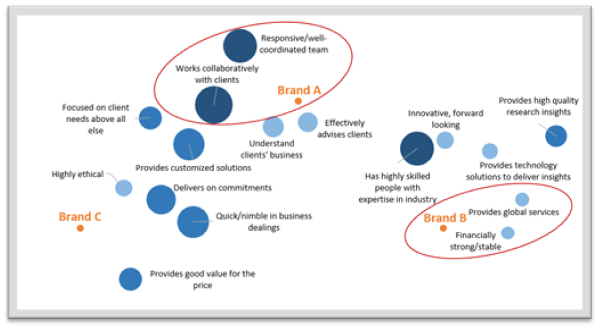
In a standard perceptual map, the attributes are shown as dots. After introducing attribute importance, the importance of each attribute is represented by the sizes of the corresponding dots. The ideal situation is that large dots (important attributes) are close to your brand. It indicates that the customer perceptions distinguishing your brand from the competition are the key areas that influence their purchase decision-making.
In the perceptual map example above, Brand A is seen as strong in working well with clients and operates as a responsive/well-coordinated team (these attribute dots are in close proximately to Brand A). The large size of the dots shows that these are also top attributes in driving customer satisfaction.
On the other hand, Brand B is viewed as financially strong and able to provide global services. Unfortunately, these attributes are not as critical in making consumers happy (the size of the dots are small).
Based on these findings, Brand A should promote its position as a partner as it is a top driver in customer satisfaction. Brand B should consider allocating resources to positioning itself as an organization with highly skilled/competent people as this is also one of the top drivers of client satisfaction.
Layering attribute importance into perceptual mapping is a critical component to informed decision making of how to position your product.


